What the Data Says: digiLab's Analysis of My 2026 Season
28 May 2026
.png)
There's a particular kind of honesty that comes from data. You can't argue with it, you can't charm it, and it doesn't care how hard you thought you were trying. For the past several months, digiLab has been running performance analysis on my racing aboard Cap Horn #40 — the Figaro Bénéteau 3 that I'll be sailing solo across the Bay of Biscay and back this summer in the Solitaire du Figaro Paprec.
What follows is a look at what the data actually revealed. Some of it confirmed instincts I already had. Some of it changed how I think about racing entirely.
The Campaign So Far
2026 has been three races: the Solo Guy Cotten in March, the Trophée Laura Vergne, and the Trophée BPGO in April — an 800-mile offshore loop visiting ten Atlantic islands. A 30th place and a 7th place have punched my ticket to the Solitaire. The data covers all three.
The goal of digiLab's analysis isn't to produce a number that tells me I was X% fast on day two. It's to build a model of what actually drives boat speed in offshore conditions — one specific to my boat, my sailing, and the conditions I encounter — so that the decisions I make in May are better than the ones I made in March.
This is digiSail. Here's what it's found.
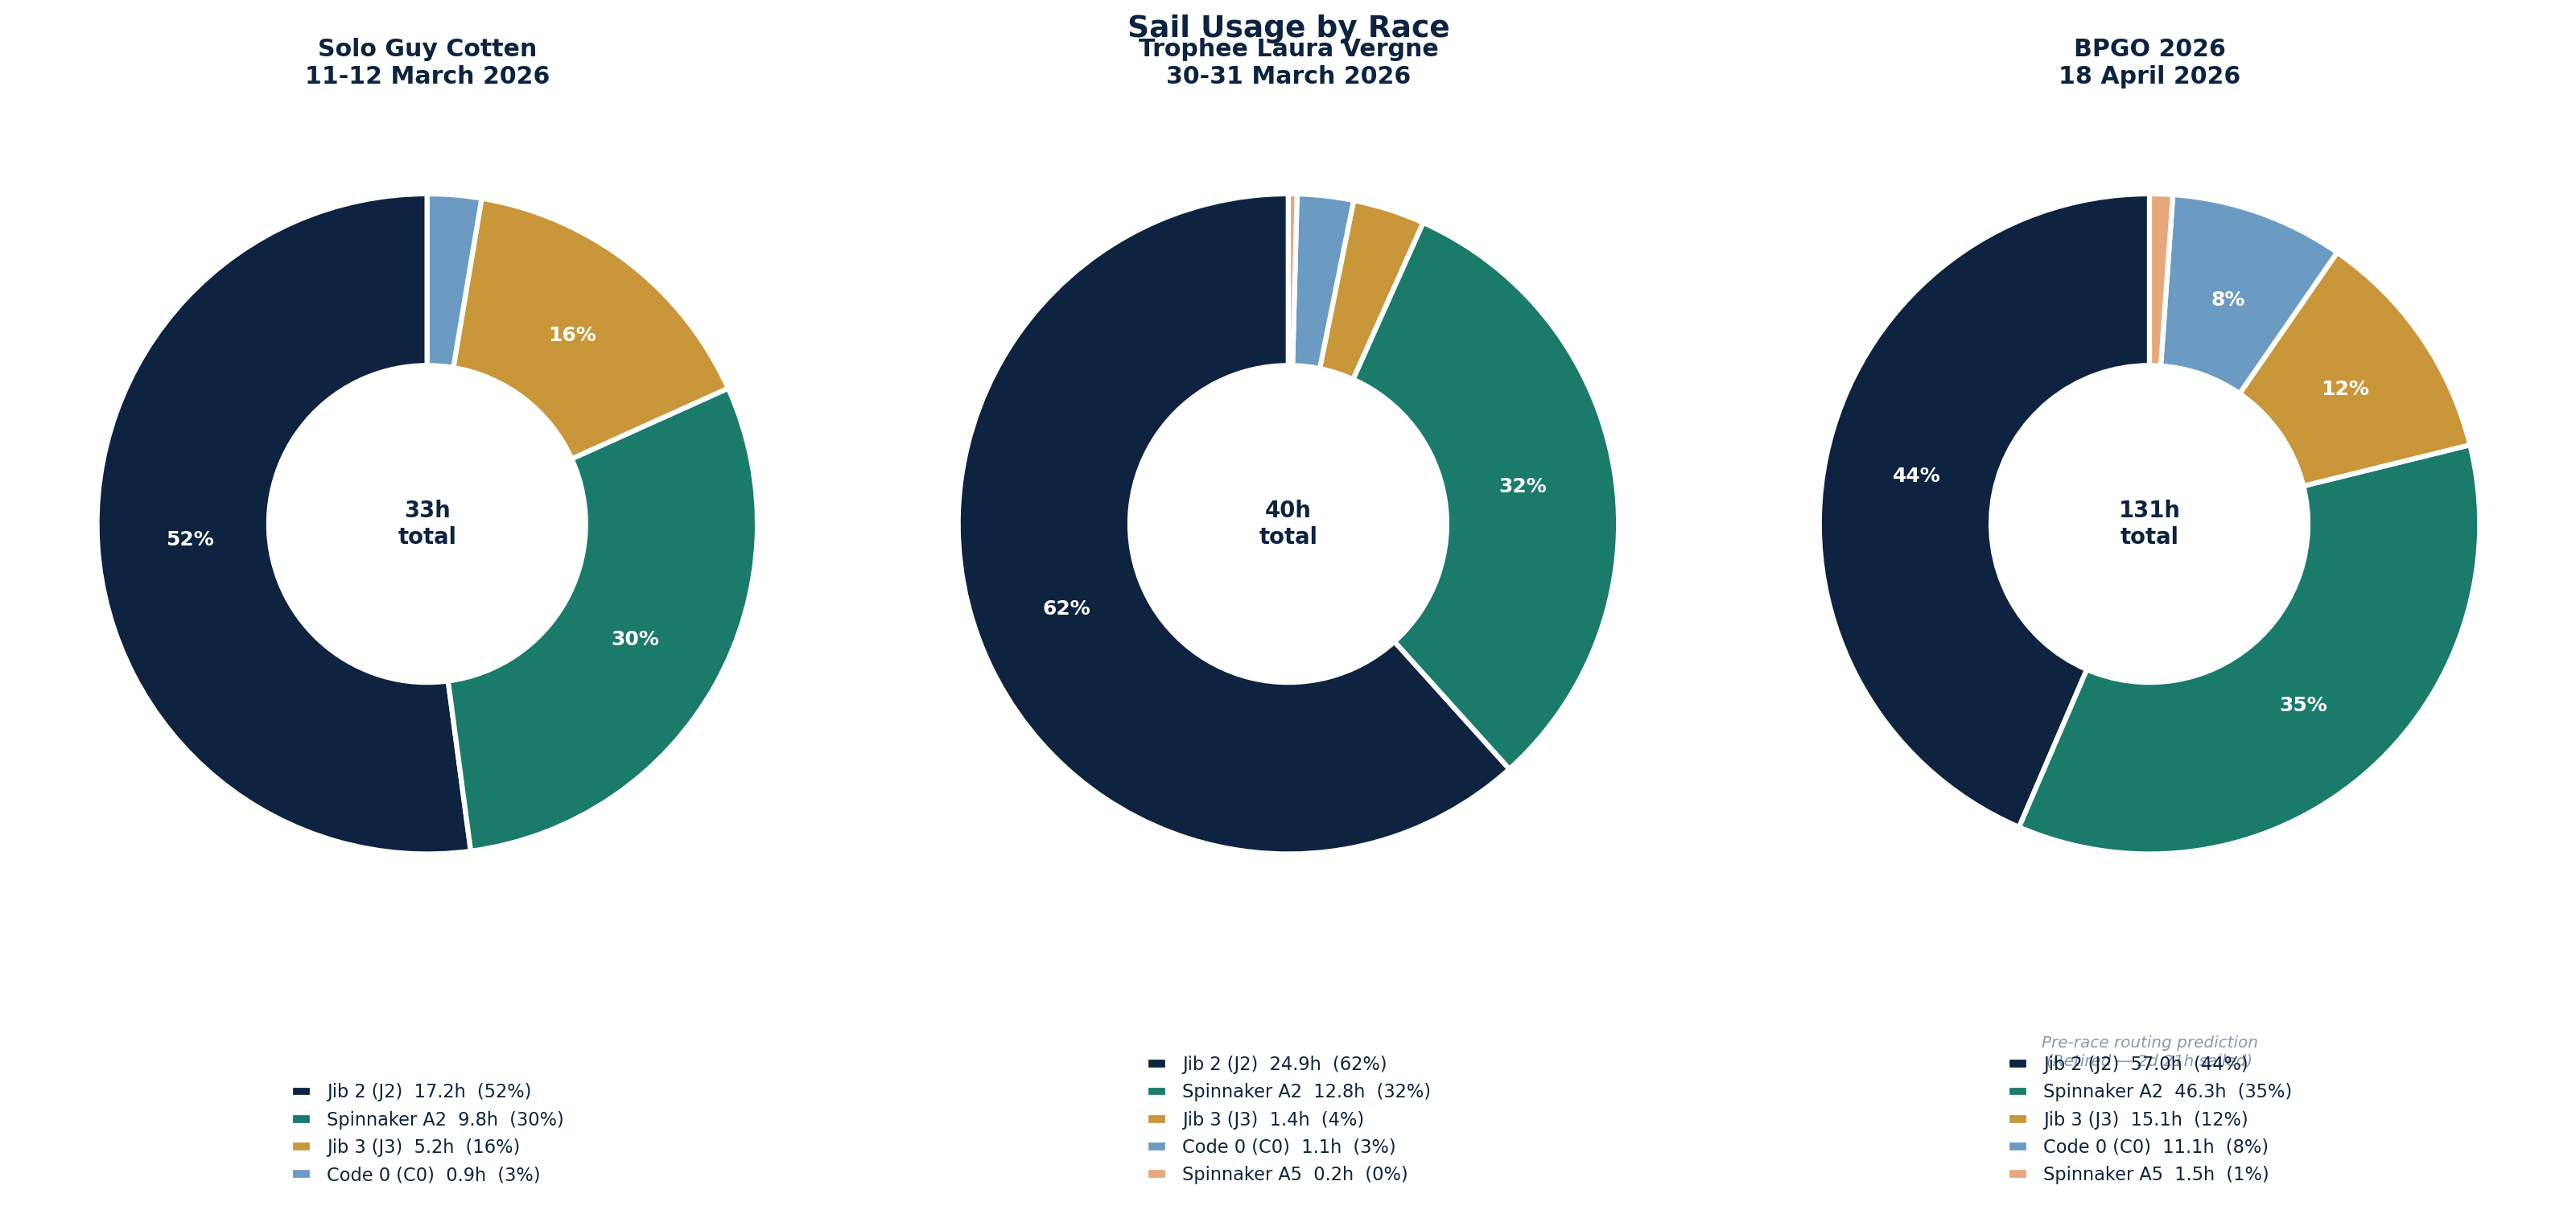
Figure 1: Sail Usage — Three Very Different Races
(Sail usage across the three 2026 races, showing percentage of total race duration for each sail)
The first thing the model mapped was simple: what was I actually flying, and for how long?
The chart tells a story you wouldn't necessarily guess from race reports. Each race had a dramatically different sail profile. Some legs were dominated by one or two sail choices — I essentially lived in the J2 or the spinnaker and barely touched anything else. Others required constant transitions and a much wider crossover range, moving across multiple sails as conditions shifted.
This matters for two reasons. First, it shows how different the tactical challenge is from race to race, even within the same class on broadly similar courses. Second — and more usefully — the BPGO values in this chart are projections based on pre-race routing predictions, because I retired before completing that race. Comparing what the model expected against what the earlier races actually required is one way of understanding where the routing assumptions were sound and where they weren't.
The practical implication: heading into the Solitaire, I now know that the Guy Cotten and Vergne profiles look relatively straightforward compared to what a long Atlantic loop demands in terms of sail management bandwidth. The Solitaire's three back-to-back legs of roughly 600 miles each will almost certainly require something closer to the BPGO complexity — and unlike the BPGO, there's no retiring.
Comparing routing prediction with reality, and being able to understand expected sail percentages going into the Solitaire is paramount, its a very intense race with minimal turn around between the three legs so not much time for Joss to rest, debrief and look to the next leg. Using insights from my performance analysis and digiLab, we can do as much of the prep work as possible beforehand, for example as Joss says above, each leg of the Solitaire is likely to be as gruelling as the BPGO in terms of sail changes and the other pressure that comes with sailing along the French coast with a lot of rocks and tidal gains inshore to be had. We can use this insight to help Joss plan his sleep between sail changes and take what he learnt on the BPGO forward into the Solitaire.
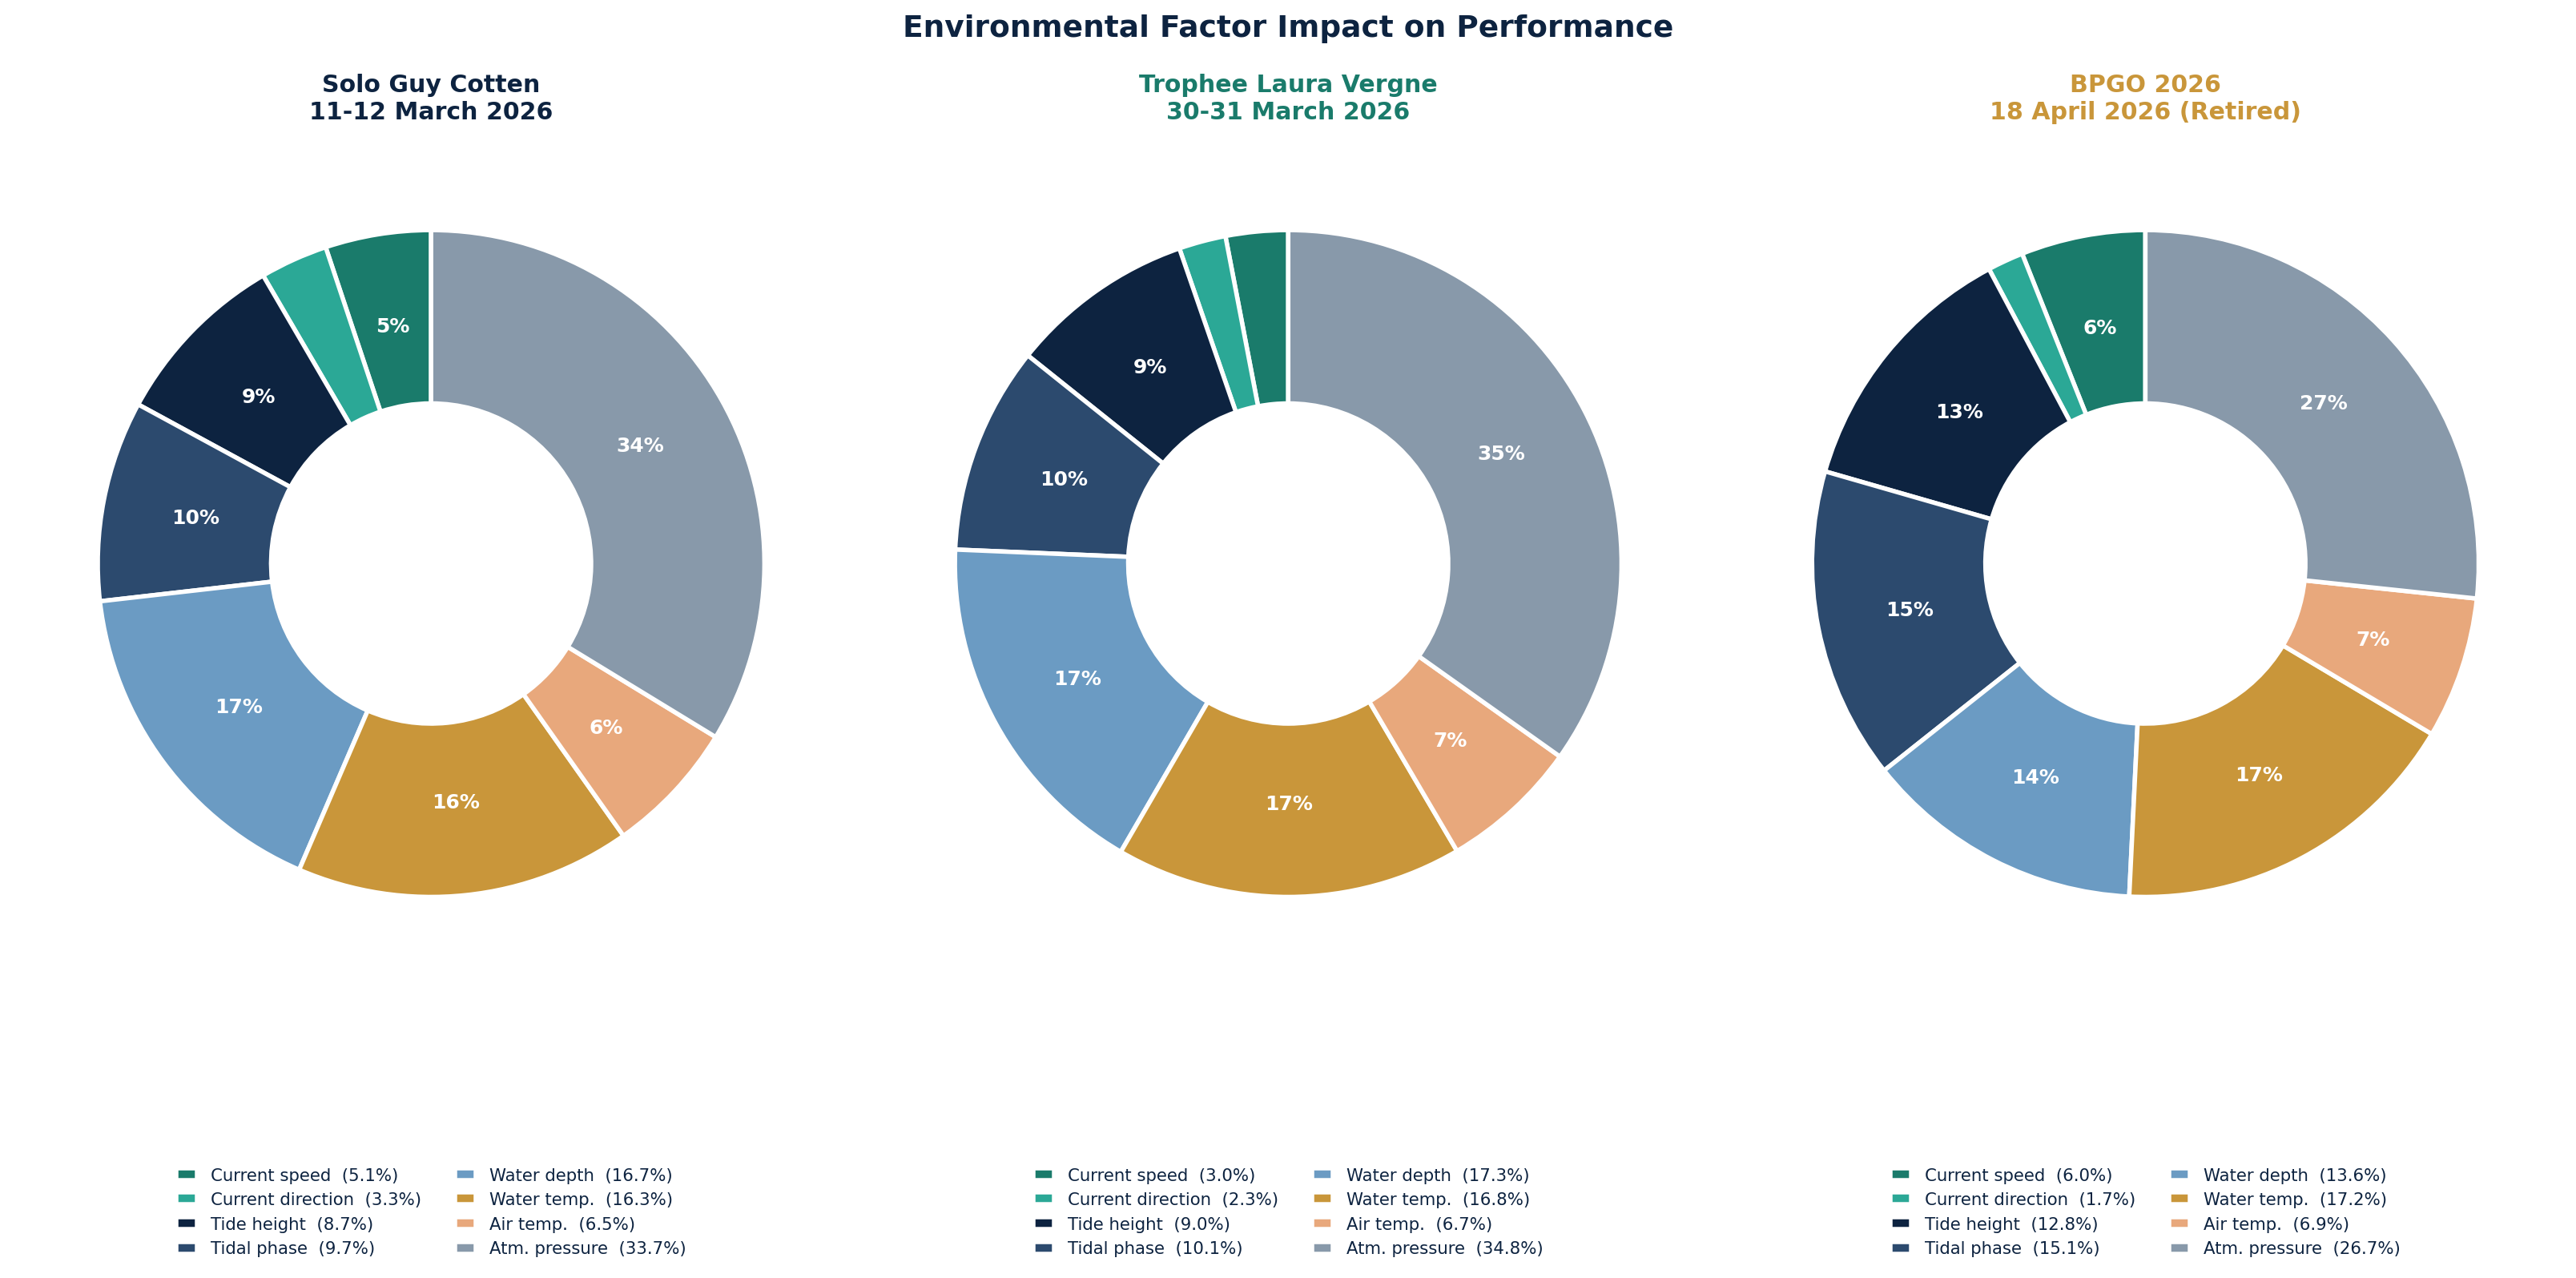
Figure 2: What Actually Defined Each Race
(Environmental impact by race — model weightings showing which variables shaped performance)
The model doesn't just ask "which variables matter?" It asks a more useful question: "which variables mattered in this race, given how far conditions moved away from the baseline?"
That distinction is important. A variable like sea state might be highly significant in general — but if every race you sail is in flat water, it's never going to be race-defining for you. The model separates "generally important" from "actually decisive."
What comes out is a fingerprint for each race. The Guy Cotten had one set of defining factors. The Vergne had another. They look quite different, and understanding why helps calibrate which variables deserve the most attention during race prep — not in the abstract, but for a specific course, in a specific season, with a specific wind climate.
For the Solitaire preparation, this analysis is running forward. Ella Boxall and I are building the meteorological picture for the expected conditions in May across the Bay of Biscay, and the model will tell us which factors are likely to be race-defining rather than just theoretically relevant.
Ella’s contribution: Understanding which meteorological factors had the most impact is really useful for us going forward into the Solitaire and using the model from digiLab we can analyse the impact of a whole lot of variables including depth, mean sea level pressure and current on performance and we are using these in our decision making in the planning and preparation of the races and then afterwards its useful to see how for example: 0.5 knots of tide against the boat inshore, vs 2 knots of tide against the boat using the offshore route impacts performance, we share some of our findings below.
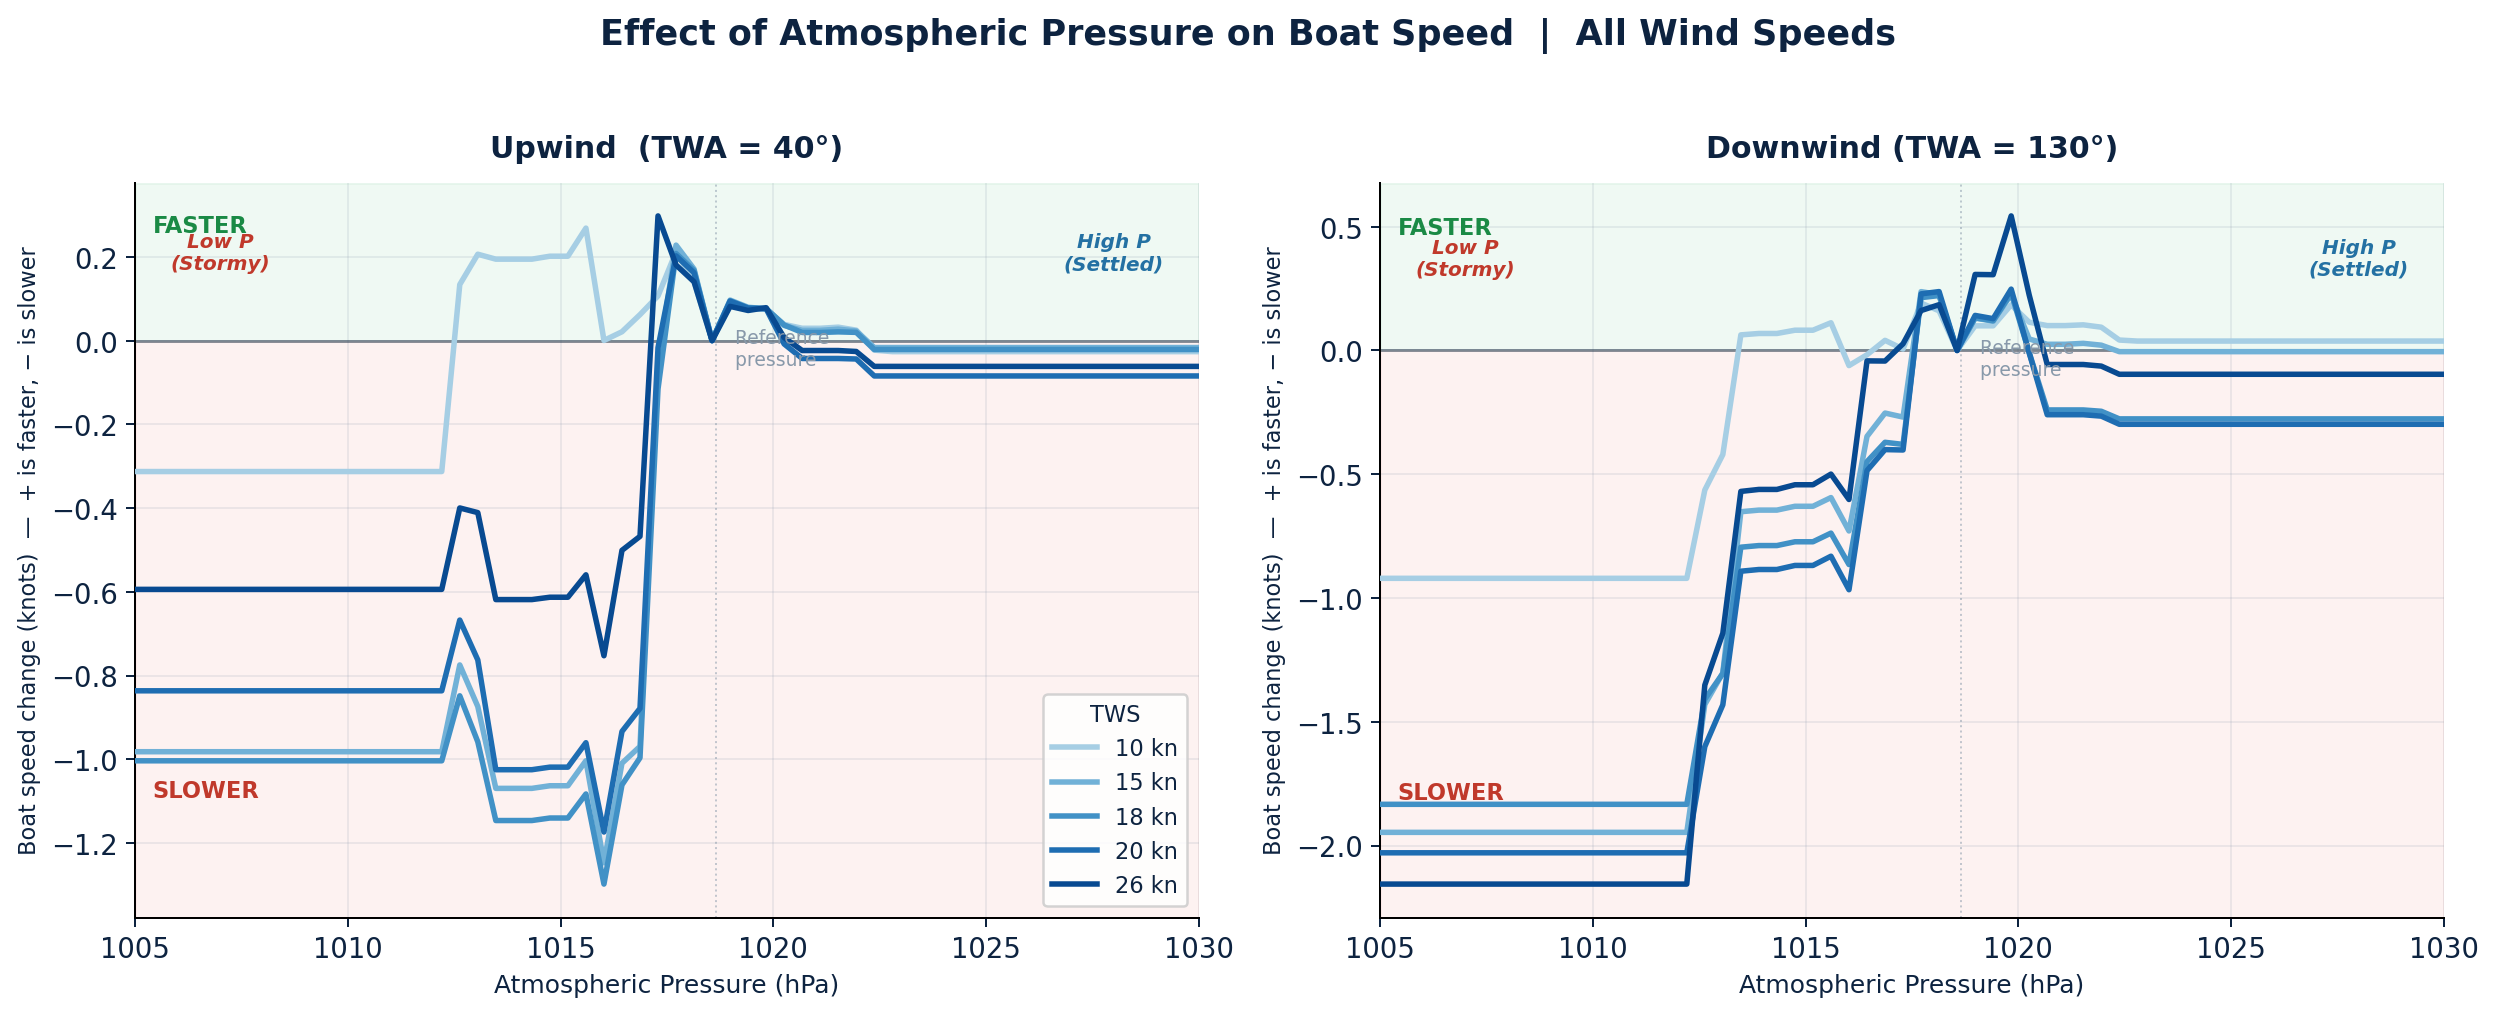
Figure 3: Atmospheric Pressure and What It's Really Measuring
(Atmospheric pressure effect on predicted boat speed, by true wind speed, upwind)
This one took a while to interpret correctly.
The model shows a clear negative effect of lower pressure on upwind boat speed — the lower the barometer, the slower the boat, especially as wind strengthens. The naive interpretation would be that pressure is directly affecting performance. It isn't. Pressure is acting as a proxy.
Lower pressure means you're sailing in or near an active weather system. Active weather systems bring disturbed sea state, gusty and less consistent wind, and generally messier conditions than settled, high-pressure sailing. The boat doesn't know what the barometer reads. But the sea state does.
This is exactly the kind of insight that's useful for routing. When I'm choosing between two paths and one puts me in a lower pressure environment — even if the wind looks the same on the GRIB — the model now tells me to expect a performance penalty that won't show up in the wind forecast alone. It's a reason to weight surface analysis charts heavily alongside GRIB files, especially for upwind work in the Biscay swell environment.
The practical takeaway: pressure as a routing variable isn't just about wind prediction. It's about sea state prediction, which offshore routing tools often handle poorly.
Figures 4, 5 and 6: The Current Problem
(Current effects on boat speed at 0.5 kt, 1.5 kt, and 2.5 kt, upwind and downwind)
Tidal and oceanic current is one of the most underestimated performance variables in offshore racing, particularly in the approaches to Brittany and across the Bay of Biscay. The model looked at three current scenarios — half a knot, one and a half knots, and two and a half knots — and the results are striking enough that I want to walk through each one.
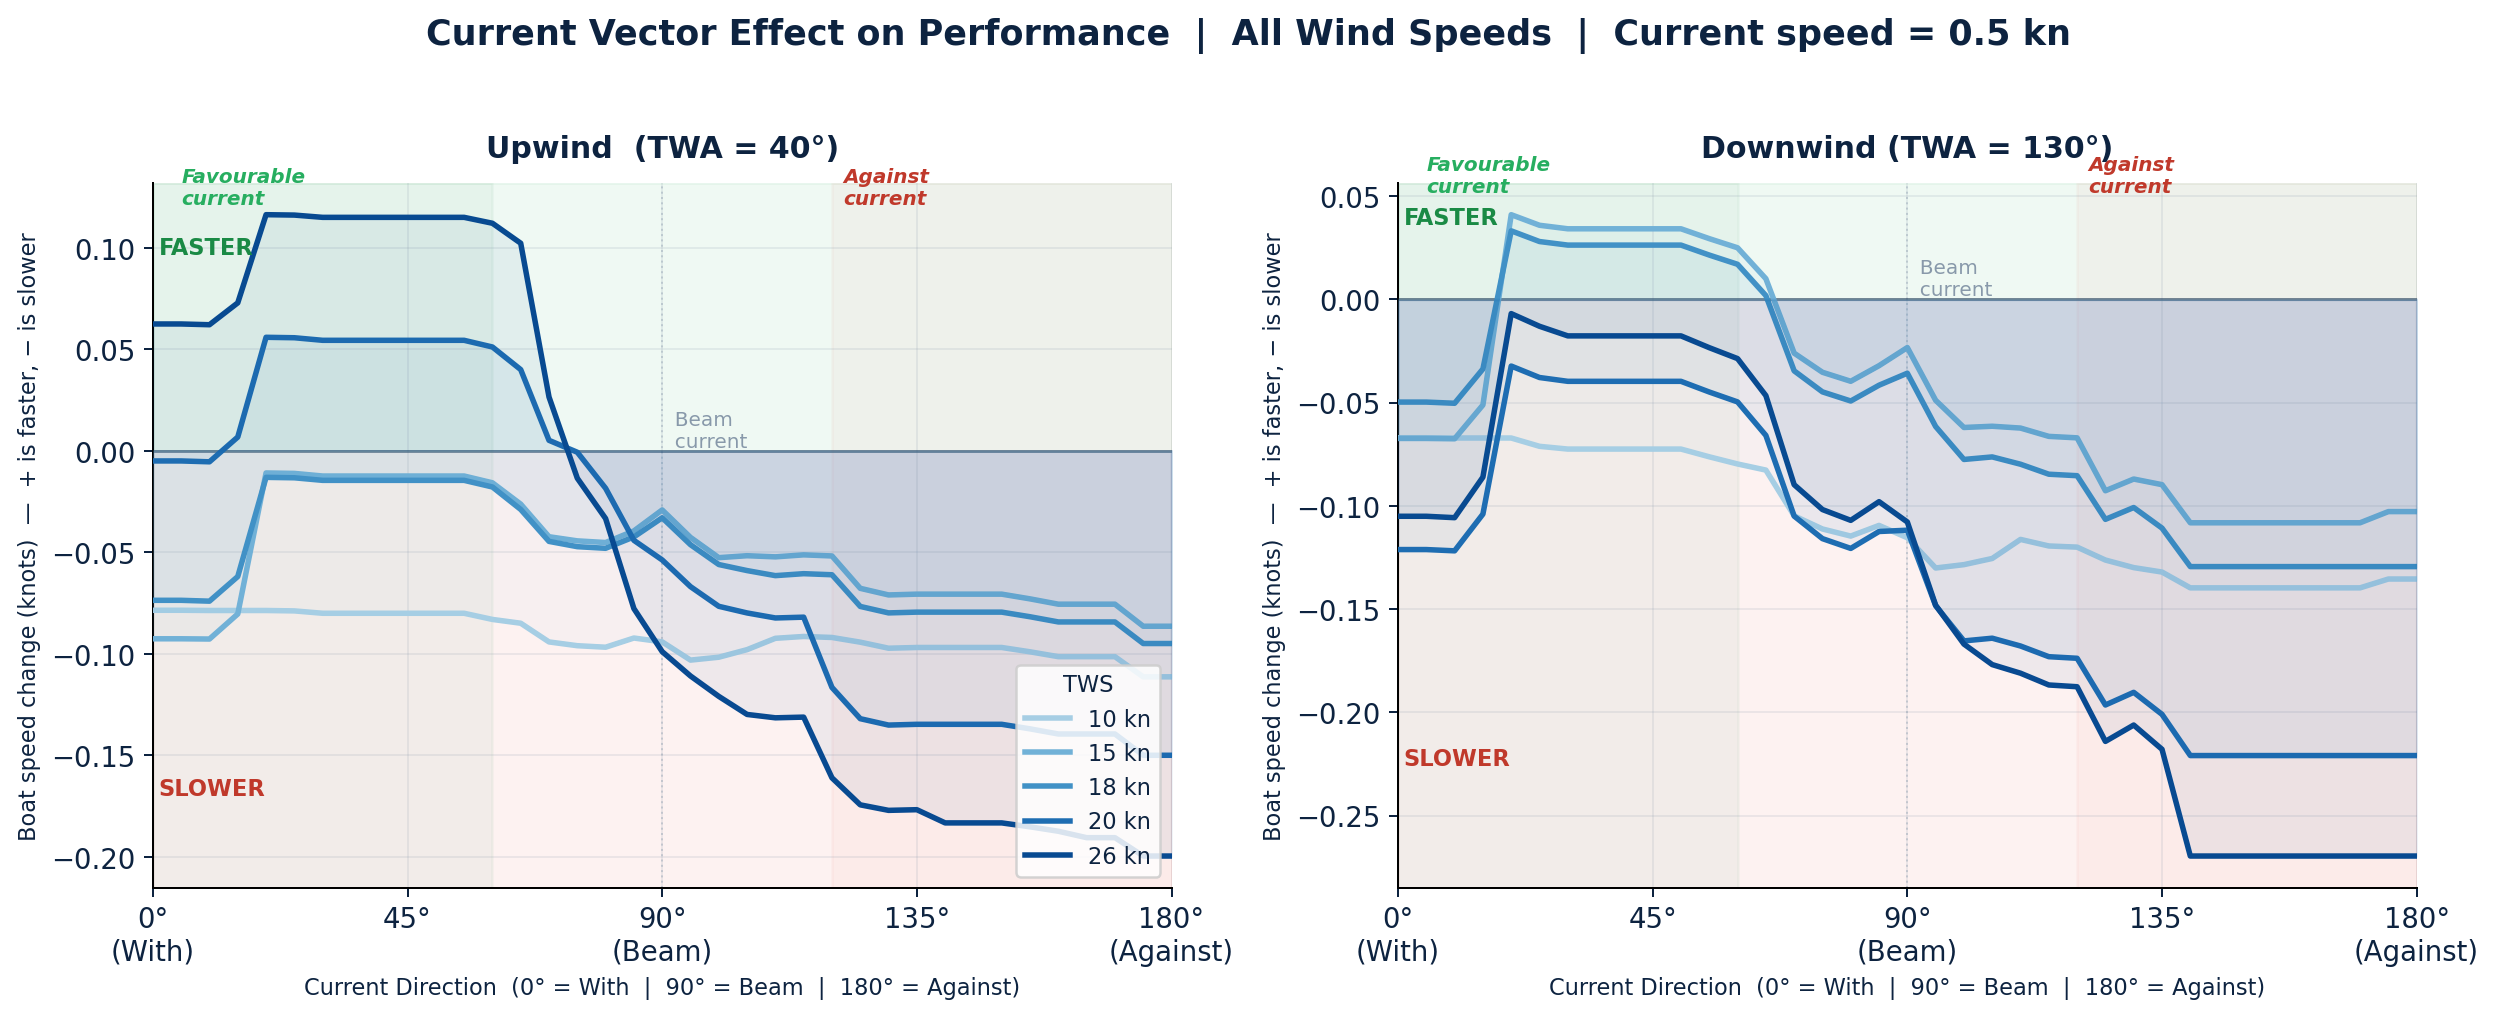
0.5 kt — Even This Matters
Half a knot of current feels negligible. In a sprint race, it probably is. Over 600 miles, it accumulates. The model shows a small but persistent performance penalty from opposing current, even at this level. Over a three-leg race where the cumulative sailing time is measured in days, those small speed losses add up to significant distance losses.
The message: don't dismiss light tidal flow when building routing strategies. At the Solitaire scale, it belongs in the calculation.
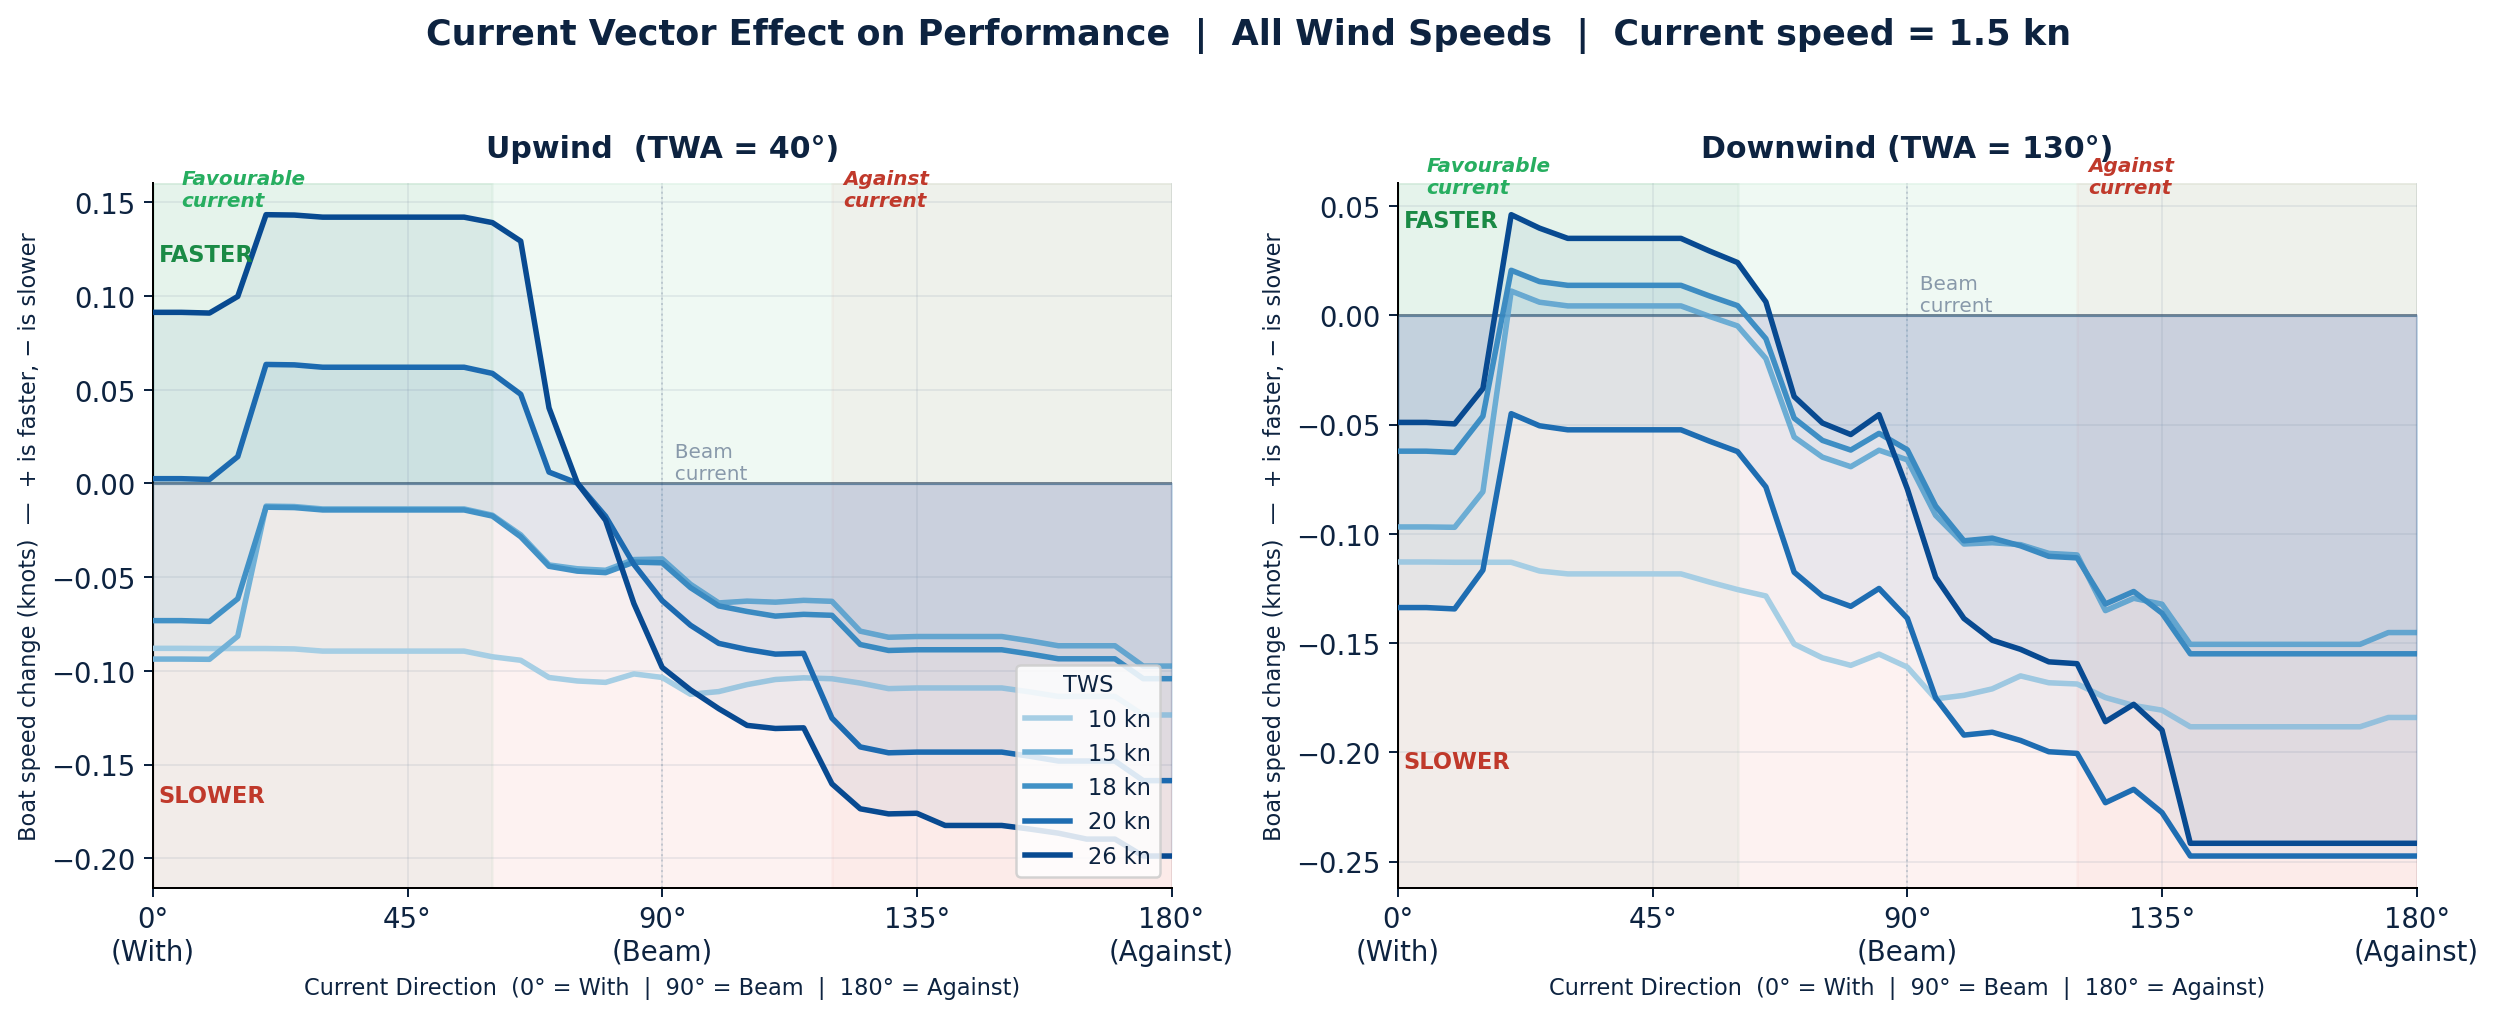
1.5 kt — The Asymmetry Becomes Clear
At one and a half knots, something important becomes visible in the data: the penalty from opposing current is larger than the gain from favourable current. This asymmetry is the key insight.
It means you can't treat current as a simple plus/minus correction when making routing decisions. Adverse current costs more than favourable current earns. If two routes have similar expected wind angles and you're choosing based on current, the decision framework should be biased toward avoiding adverse current rather than chasing favourable current. Risk-adjusted, the downside is worse than the upside is good.
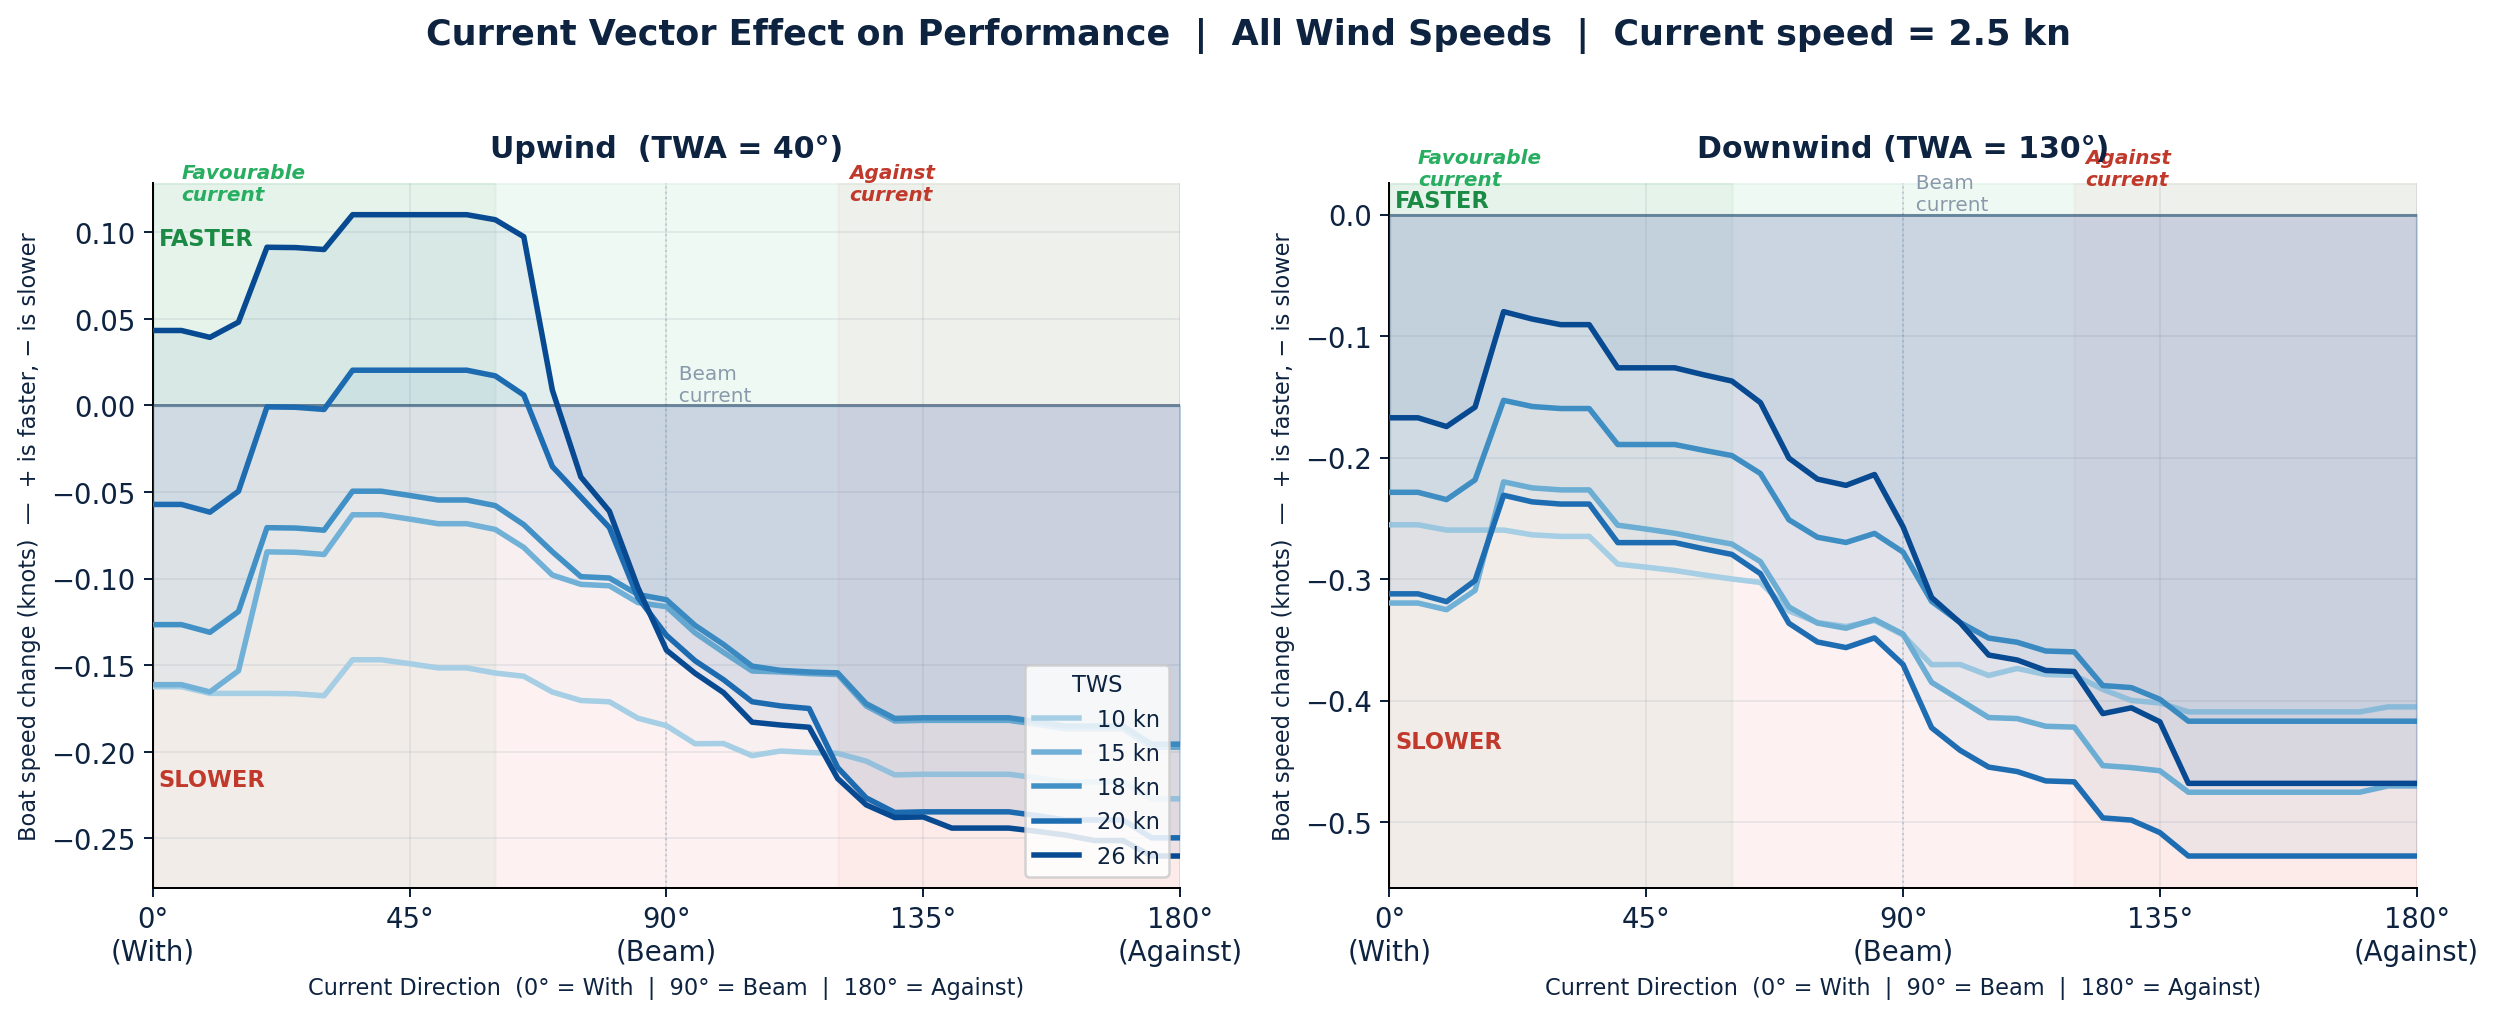
2.5 kt — The Counter-Intuitive Result
Strong current produces the most dramatic performance shifts, and the most interesting one. As expected, adverse current at 2.5 knots is punishing — over 0.4 knots of boat speed lost downwind. But the model also shows something counter-intuitive: strong following current can reduce downwind boat speed by reducing apparent wind.
Sailing downwind, you're already chasing the wind. If the current is carrying you faster in the same direction as the wind, apparent wind drops further. Sail selection and sail trim optimised for one apparent wind angle are now wrong for a different one. The boat is physically faster through the water over the ground, but not necessarily sailing as efficiently as the numbers suggest.
This has direct implications for spinnaker selection in tidal gates. A strong following current during a downwind leg isn't the free ride it looks like on the routing software.
What This Means for May
The Solitaire is three legs of approximately 600 miles each, with mandatory stops in between. The race is, in some sense, three races that must be approached differently depending on where you are in the overall standings — but it rewards consistency above almost everything else.
What digiLab's analysis has given me going into it is a set of calibrated priors. I know which environmental variables are likely to define performance versus which ones are noise. I know that the pressure-performance relationship is really a sea state relationship, and that I need to weight chart analysis accordingly. I know that adverse current costs more than favourable current earns, and that strong following current in downwind conditions needs active sail management, not passive gratitude.
None of this replaces the sailing. But it changes the quality of the decisions made while sailing — particularly at two in the morning on day three of leg two, when the instinct is to rely on pattern recognition built from less rigorous sources.
That's the point of digiSail. When uncertainty matters, you want the best model available.
Next Step Racing is supported by digiLab, Mustang Survival, and Lorient Grand Large. Follow the Solitaire campaign at @jossbatross on Instagram and josscreswell.substack.com.
All figures made by Ella Boxall, Niskus Performance Ltd with access to the models and insights created by digiLab.